TeleportScienceNav
Application Examples
Protese Inibition

An evolving field of applications of drug-related peptidomics is the analysis of protease inhibitors and their impact on the peptidome. To evaluate a protease as a potential drug target, it is beneficial to identify its substrates and products in vivo as this may impact the drug development process since specificity of inhibitors, and thus limiting side effects, can be predicted more accurately.
To learn more please download the presentation summarizing the utility of Peptidomics for protease inhibitor research.
Introduction
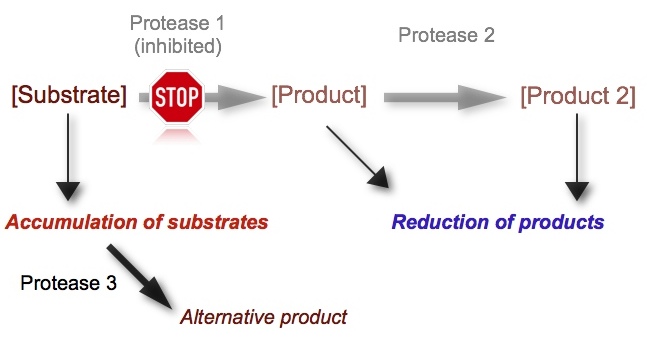
The principle of protease inhibition plays an important role in drug discovery and modern medicine. The human genome contains more than 550 different proteases and peptidases, and also a considerable number of protease inhibitors. Since peptides are generated from larger precursors by the irreversible hydrolysis of a peptide bond, the peptidome reflects a natural library of substrates and products. Sequence analysis reveals the specific cleavage site present in the peptide or its precursor, and consequently this peptide is suspected to be a substrate or product of the inhibited enzyme. Consequently peptidomics is an excellent tool to evaluate a protease inhibitor in vivo by identifying its substrates and products and thus supporting the drug development process.
Influence of Protease Inhibition on Plasma Peptide Pattern
This example demonstrates the use of Peptidomics® as a suitable tool for the characterization of proteases and their inhibitors in vivo. We performed a study to evaluate the effect of protease inhibition on blood peptides in a rodent model. Rats were treated with a protease inhibitor or vehicle and blood samples were analyzed by Peptidomics®.
The treatment with the protease inhibitor resulted in a dose dependent decrease of protease activity.
More than 3,000 signals were shown in a mass range < 15 kDa. Correlation analysis with residual enzymatic activity showed that approx. 55 peptides were decreased or increased in abundance.
The treatment with the protease inhibitor resulted in a dose dependent decrease of protease activity.
More than 3,000 signals were shown in a mass range < 15 kDa. Correlation analysis with residual enzymatic activity showed that approx. 55 peptides were decreased or increased in abundance.
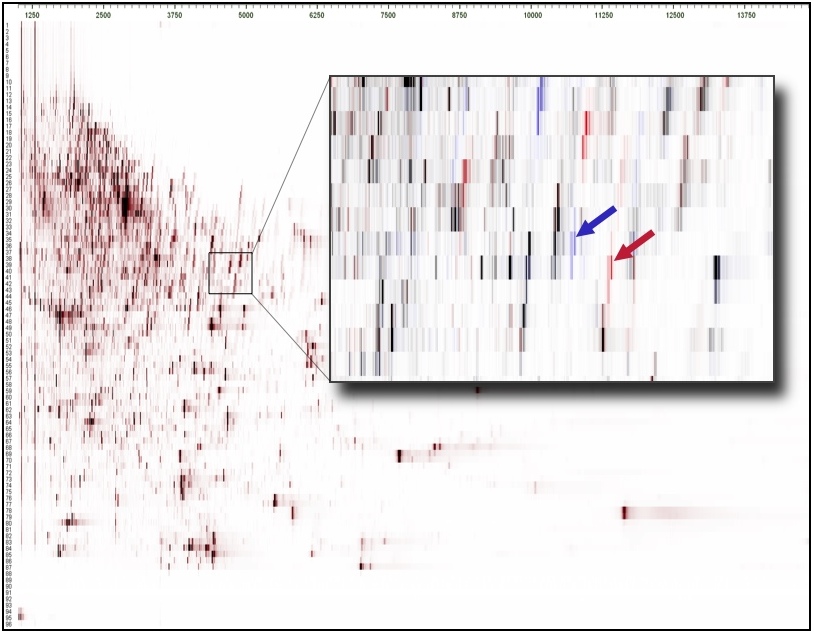
The sequence analysis revealed both peptides which are marked in Figure 1
Due to the truncation of the peptide a shift in the molecular mass hydrophobicity is visible in the Differential Peptide Display. To evaluate the abundance of both peptides all mass spectra of the corresponding region (molecular mass and hydrophobicity) are compiled:
- derived from the same precursor protein
- the peptide marked with a blue arrow corresponds to a truncated form of the peptide marked with an red arrow
- the cleavage site corresponds to the known protease specificity
Due to the truncation of the peptide a shift in the molecular mass hydrophobicity is visible in the Differential Peptide Display. To evaluate the abundance of both peptides all mass spectra of the corresponding region (molecular mass and hydrophobicity) are compiled:

This example demonstrates the suitability of Peptidomics® to profile drug action of protease inhibitors in vivo providing a method to identify drug targets and potential adverse side effects.
Further reading:
Peptidomic analysis of blood plasma after in vivo treatment with protease inhibitors--a proof of concept study
[Peptides. 2008 Dec;29(12):2188-95]
In vivo profiling of DPP4 inhibitors reveals alterations in collagen metabolism and accumulation of an amyloid peptide in rat plasma
[Biochem Pharmacol. 2009 Jan 15;77(2):228-37]
Sample Quality Assessment

The determination of sample quality is an important issue to ensure validity of results. Particularly in the field of multiplex assays it is a prerequisite for effective study outcomes. Sample Quality Scoring by Peptidomics is a versatile tool to qualify biological specimens. The analysis of pre-analytical biases allow for characterization of samples, detection of outliers and recognition of erroneous sample handling procedures.
Pre-analytical procedures can confound the outcome of preclinical and clinical studies. In particular sample collection and specimen preparation can alter the validity of results obtained by modern multiplex assays (e.g. LC-MS). Quality assessment of collected samples is crucial to avoid systematic biases. In order to address pre-analytical biases we applied Peptidomics® to grade samples. The analysis of native peptides (Low Molecular Weight [LMW-] proteome) in biological specimens is primarily achieved by chromatographic methods coupled to multiple forms of mass spectrometry. Peptides as products of proteolytic cleavage events exhibit a close connection to protease activity. Increased or altered activity of proteases during sample collection, specimen generation, sample storage and processing are mirrored by alterations in abundance of specific peptides. To demonstrate this approach we analyze different blood specimens to elucidate biological events occurring during the pre-analytical phase by Peptidomics® and qualify the specimens by Sample Quality Assessment (SQA).
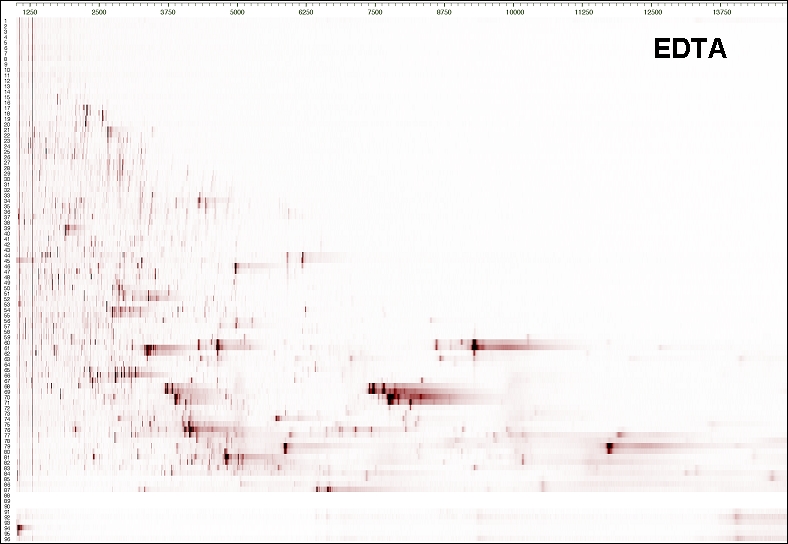
Peptide displays of the 6 blood specimens (EDTA plasma, citrate plasma, CTAD plasma, serum with and without clot activator and P100v1). The x-axis displays the mass-to-charge ratio, the y-axis is determined by the retention time on the RP-HPLC. The signal intensity is depicted by color saturation.
Characterization of Blood Specimens by Sample Quality Assessment
To assess the quality of a given sample an aliquot of the respective sample is analyzed via Peptidomics® to obtain peptide profiles: briefly, peptides were extracted and separated in 96 fractions by liquid chromatography. An aliquot of each fraction was subjected to MALDI mass spectrometry. Data analysis is carried out to retrieve significant mass spectrometric signals representing surrogate peptides for pre-analytical events. By analyzing the abundance of these surrogate peptides (n=77) distinct biological events (coagulation (23), kallikrein activation (18), complement activation (8) and cell lysis (25)) and their significance can be attributed to each sample to ensure comparability between samples. EDTA, Citrate and CTAD plasma exhibit a more similar pattern in comparison to Serum and P100v1. The latter specimens show signs of cell lysis, coagulation and activation of kallikrein. An in-depth analysis of EDTA, Citrate and CTAD plasma also demonstrate pronounced differences between these specimens. The main purpose of this study was to demonstrate the massive impact on generation of artificial ex-vivo generated peptides within the different specimens. The foremost application of this approach would be the characterization of sample quality inside study populations to determine possible pre-analytical biases.
Sample Quality Chart
Peptide surrogate markers were exported and analyzed according to distinct biological events.
Peptide surrogate markers were exported and analyzed according to distinct biological events.
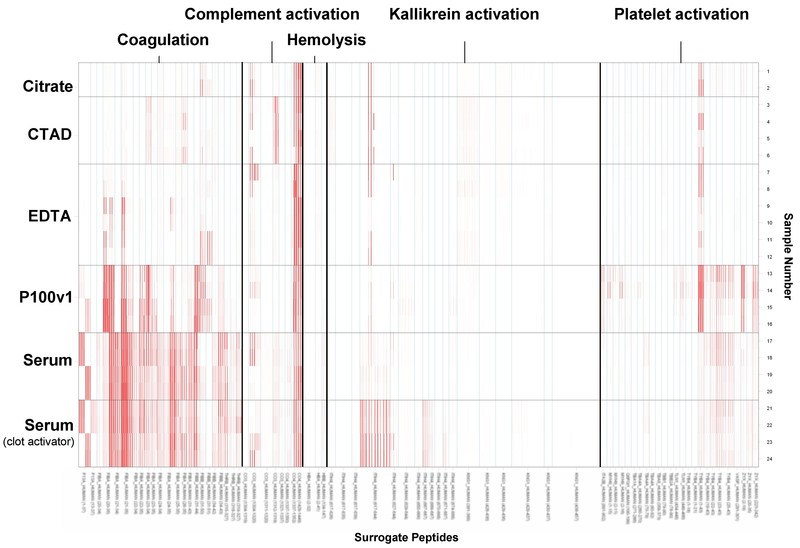
The left axis depicts the human blood specimen, the bottom axis the surrogate peptide (precursor abbreviation and amino acid range) and the top axis the biological event represented by groups of surrogate peptides. It is clearly visible that Serum and P100v1 exhibit significant signs of coagulation and cell lysis. Additionally the clot activator in serum samples lead to an activation of plasma kallikrein (surface activated).
Further reading:
Specimen collection and handling: standardization of blood sample collection
[Methods Mol Biol. 2008;428:35-42]
Prerequisites for peptidomic analysis of blood samples: I. Evaluation of blood specimen qualities and determination of technical performance characteristics
[Comb Chem High Throughput Screen. 2005 Dec;8(8):725-33]
Peptidomic analysis of human blood specimens: comparison between plasma specimens and serum by differential peptide display
[Proteomics. 2005 Aug;5(13):3414-22]