View Tab
This panel allows to customize the data display and to perform statiscal analyses.
View Tab
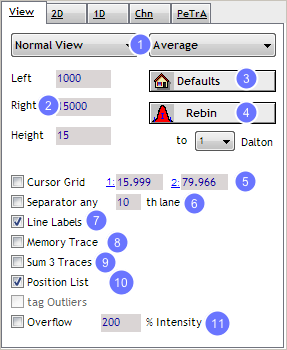
The view panel provides opportunities to customize the data display:
1. The listboxes on top are used to switch from normal view to specialized illustrations i.e. of differences from data in the current view and the memory and to change the scaling from average to maximum.
2. The left, right and Height fields denote the margins of clipping when zooming in and out. The displayed region and the height of lanes can be modified by entering manually the values.
3. The default button sets the values for height, left and right to the values defined in preferences and to a default intensity.
4. The Rebin button allows to set bin size (1, 0.5, 0.1, 0.05). This can also be done via Menu - Process- Resampling.
5. The cursor grid box activates 2 lines displayed right and left of the cursor position at the given positions. The psition can be adjusted manually or by clicking on the 1 or 2 to select post-translational modifications or amnio acids.
6. The seperator box activates marks between lanes in the given intervall.
7. The line labels box marks the selected lane.
8. The memory trace box activates the display of the corresponding mass spectrometric stored in memory.
9. The sum 3 traces box calculates a sum value of the surrounding two lanes to the selected one .
10. The position list displays the positions of a loaded position list as red boxes on the current view.
11. The overflow box labels regions above a given intensity in the current view.