Interface
Introduction to Spectromania
The Graphical User Interface - Main Sections
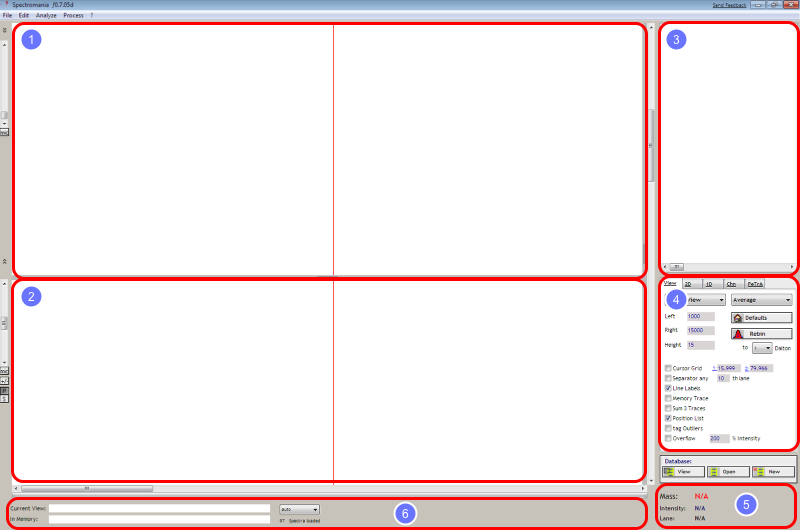
The main interface is divided into different sections :
1. The current view: Loaded mass spectra are displayed as a gel-like view.
2. The trace view: Selected mass spectra from the current view are displayed as graphs. Furthermore results from statsitical calculation are displayed here.
3. The spectra list: The listbox contains the name of loaded mass spectrometric files.
4. The tab panel: To modify the current view, to interact with the memory layer or to perform statistical calculations appropriate parameters can be selected here.
5. Cursor position: The position of the cursor and the corresponding values (mass (x-value), intensity (z-value) and the lane (y-value) are displayed here.
6. Status bar: Name of datasets in the current view and datasets stored in memory layer are shown here. Additionally the progress indicator and activity messages are displayed.
The Graphical User Interface - Further Elements

The main interface contains further elements :
1. This button allows to extend the current view, thereby hiding the trace view.
2. The slider allows to increase the saturation of the display.
3. This button hides or shows the results of the 1D statistical calculations.
4. The slider allows to zoom in or out in the trace view.
5. The P and S button allow to select the region in the trace view for zooming : P=Trace View; S= statistical results
6. The horizontal spacing between the current view and the trace view can be modified by draging up or down. The cursor will change to a double-side arrow.
7. The vertical spacing can be changed here (see No.6)
8. The scroll bar allows to change the displayed the region (x-axis).
9. The scroll bar allows to change the displayed the region (y-axis).