General Concept
This section decribes basic conceptual ideas. Mining or analysis of data obtained by mass spectrometry to unravel relevant information can be done by a plethora of software tools.
These tools mainly rely on extracted signal intensities from pre-defined peaks and normally do not use the entire information present in a mass spectrum. Furthermore relations between peaks in different spectra are often hard to recognize due to the diverse nature of these relations (e.g. mass shifts or adducts).
However the result of data mining procedures has to be interpreted at the end with mass spectrometric expertise.
One possibility to overcome these issues is the visualization of mass spectrometric data by a convenient but powerful approach.
To visualize mass spectrometric data PXBioVisioN uses the software Spectromania. All mass spectra are combined for each individual sample to a two-dimensional display of peptides based on their molecular masses and elution characteristics. The intensity of each mass-spectrometric signal is translated into color intensity.
The human eye has an extraordinary ability to perceive huge amounts of data (approx. 10 Mill. bit). The human brain is specialized to process visual data in an efficient way. Consequently visualization of data is very useful to aid the process of knowledge extraction from complex data structures. Spectromania enables the scientist to reveal information hidden in datasets in an easy and convenient way. Furthermore the interactive approach, the conjunction with experimental variables and the possibility to perform statistical calculation allows to assess mass spectrometric data in a completely new way.
Visualization Concept
Each mass spectrometric file is automatically converted into a gel-like view: The intensity is depicted as a shade of color. The view changes from a front view to a top view. This steps improves the perception of multi-dimensional data.
Multi Dimensional Display of Mass Spectrometric Signals
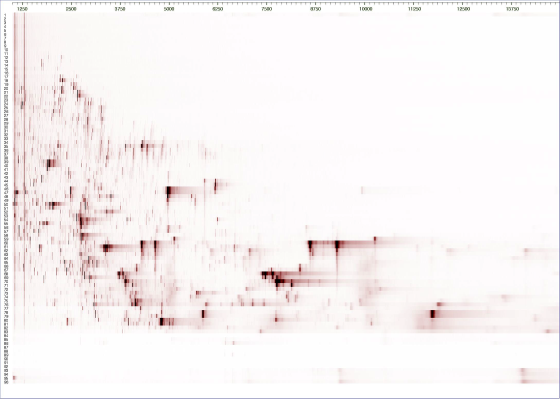
The figure shows the basic concept of multi-dimensional displays of mass spectrometric data. Each mass spectra is aligned to a display depicting MS signals as dots. Mass spectra derived from one fractionated sample are grouped. The intensity and area corresponds to the measured signal intensity. The colored circles indicate signals as examples which were transformed from a front view to a top view. Each display consists of 1-20 Mill. datapoints. The number depends on the actual binning of the data.
Layer Concept
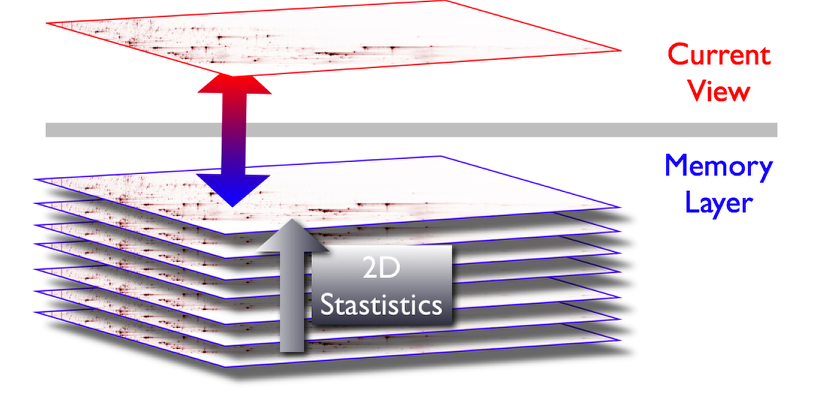
Spectromania supports two kinds of data layers:
The current view and the memory layer.
Data is transfered via the current view to the memory layer. In order to store data in the memory layer, it is first required, to load data into the current view.
While the memory layer can store numerous datasets, the current view always contain only one dataset.
The memory layer is used to perform various statistical calculations on stored datasets.
The current view is supposed to display the results of these calculations.