File Menu
The menu items within the file menu are explained.
Menu
The menu bar contains five elements: File, Edit, Analyze, Process and Help.
File Menu
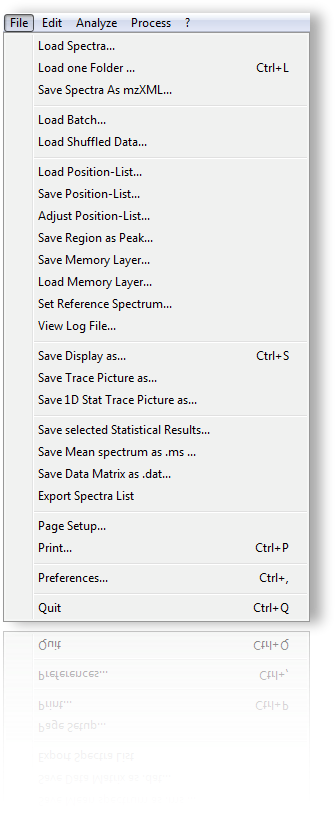
The file menu contains items for loading and saving data. Aditionally preferences can be set.
Load Spectra
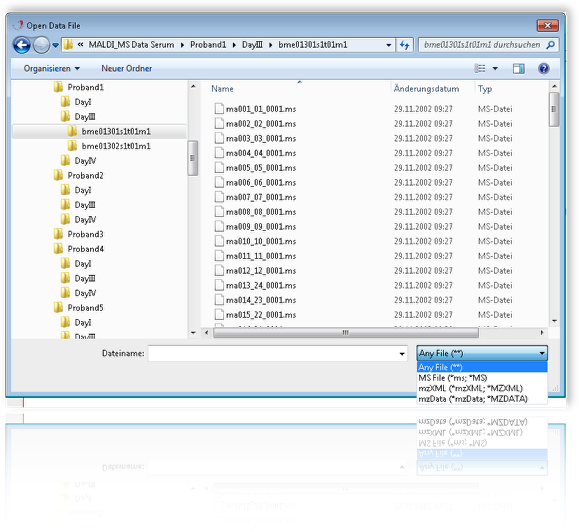
To load individual mass spectrometric data just double click the file and spectromania will import the spectra. Various filetypes are supported : T2D, MS, txt, mzXML, mzData. When finished click cancel to end the dialog.
Load one Folder
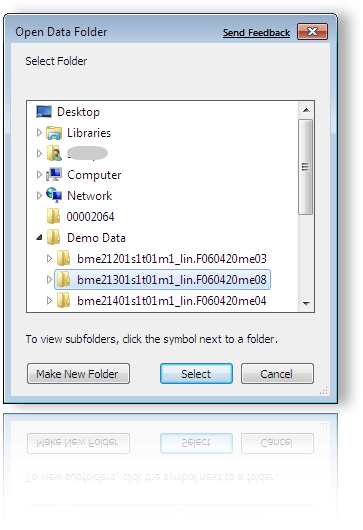
To load an entire folder containing supported data types just chose the corresponding folder and click Select.
Load Batch: Load Spectra from hierarchical Folders
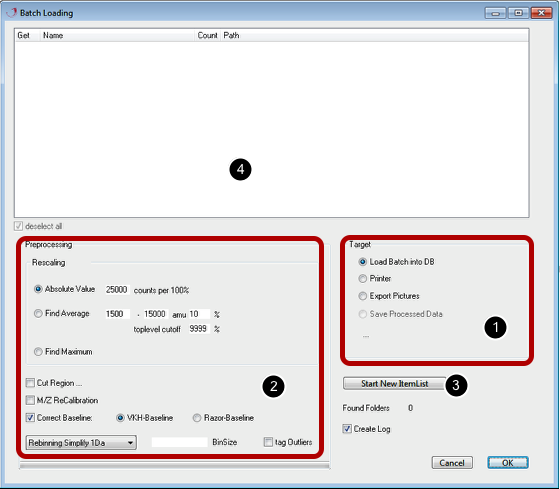
This dialog is intended to simplify the loading process of a batch of measurements. Each group of spectra has to be located in a folder of its own to be recognized as a group.
[1] Section "Target":
There are different possibilities to process the data. You can store the data in a database for statistical analyses or you can create gel-like images from the data and save them to a folder or print them out directly.
Load data into a database:
*Select Datasets
To start the batch loading you have to select an existing database or create a new one in the main Spectromania window.
Click "Start New Item List" button [3]. An dialog appears where you can choose the folder containing your data. Subfolders can be in a hierarchical structure since the program cycles through them to create a list of datasets, showing the folder name, the number of items in each folder and the filesystem path [4]. The datasets in the list can be selected to be included.
[2] Preprocessing:
Rescaling:
There are several possibilities to rescale the data during batch loading:
You can choose between three methods. Each spectra will be rescaled according to your selection. The data can either be rescaled by
1. setting a fixed value to 100% (absolute scaling)
2. setting an average value or
3. setting a maximum value to 100%.
2. and 3. offer the possibility to define a mass range, the intensity level and a cut-off level.
Cut region
Sometimes at the end of spectra artifacts may occur. These artifacts impede a proper baseline correction or result in spectra with different number of points. To prevent this it is possible to truncate the spectra at both ends.
*m/z Recalibration
The recalibration algorithm tries to align data to a pattern normally occurring in mass spectra.
Correct baseline
Correct Baseline can be done by a bayesian method (Razor-Baseline) or by an in-house developed baseline correction, which is generally sufficient but much faster (VKH-Baseline).
Rebinning
Data can be reduced to 1 dalton bins, resampled to a user-defined bin size, aligned to a reference spectrum (which can be chosen from the main menu "File - Set Reference Spectrum" or in the preferences ) or as raw data (none).
Outliers
Checkmark to tag outliers checkmark. The threshold (defined as the mean signal intensity) has to be set in the main menu "Analyze - tag Outliers".
Load Shuffled Data
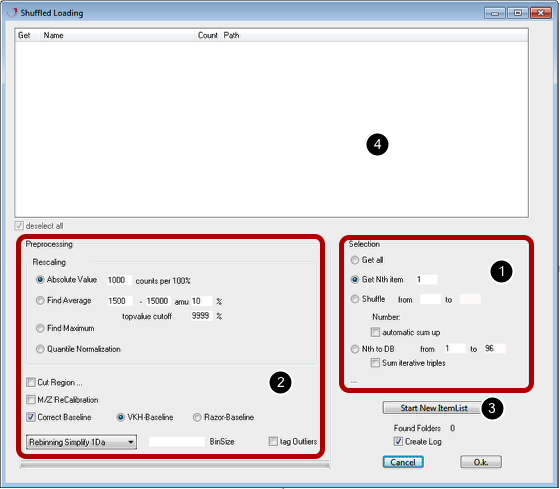
The load data from multiple folders into the main window this function can be used. Incontrast to "Load Batch" data will be loaded into the current view, but it is optionally possible to load data into a database. This dialog is intended to automate the process of loading of a set of measurements in a certain pattern into the current view or the database.
Select Datasets
Click "Start New Item List" button [3]. An dialog appears where you can choose the folder containing your data. Subfolders can be in a hierarchical structure since the program cycles through them to create a list of datasets, showing the folder name, the number of items in each folder and the filesystem path [4]. The datasets in the list can be selected to be included.
Selection [1]
There are 4 possibilities to process the data:
a) load all listed spectra in the current view
b) load only the nth spectrum from each folder
c) load several spectra from each folder and optionally performed a summation of each group of spectra
d) store spectra in a database
"Get all" loads all data from the list into the current view.
"Get Nth Item" loads each specified nth file from each folder
"Shuffle" loads multiple spectra (a range of spectra) from each folder into the current view. Optionally a summation of spectra is possible.
"Nth to DB" loads selected files into a database. The files specified ("from" - "to") are grouped from all folders. Optionally a summation of three spectra is possible.
Preprocessing [2]
Rescaling
There are several possibilities to rescale the data during batch loading:
You can choose between four methods. Each spectra will be rescaled according to your selection. The data can either be rescaled by
1. setting a fixed value to 100% (absolute scaling)
2. setting an average value or
3. setting a maximum value to 100%.
4. quantile normalization
2. and 3. offer the possibility to define a mass range, the intensity level and a cut-off level.
Cut region
Sometimes at the end of spectra artifacts may occur. These artifacts impede a proper baseline correction or result in spectra with different number of points. To prevent this it is possible to truncate the spectra at both ends.
m/z Recalibration
The recalibration algorithm tries to align data to a pattern normally occurring in mass spectra.
Correct baseline
Correct Baseline can be done by a bayesian method (Razor-Baseline) or by an in-house developed baseline correction, which is generally sufficient but much faster (VKH-Baseline).
Rebinning
Data can be reduced to 1 dalton bins, resampled to a user-defined bin size, aligned to a reference spectrum (which can be chosen from the main menu "File - Set Reference Spectrum" or in the preferences ) or as raw data (none).
Outliers
Checkmark to tag outliers checkmark. The threshold (defined as the mean signal intensity) has to be set in the main menu "Analyze - tag Outliers".
Save Spectra as mzXML
The data loaded into the current view can be saved in a mzXML format. For details about this fomat please visit Wikipedia.
Load Position-List
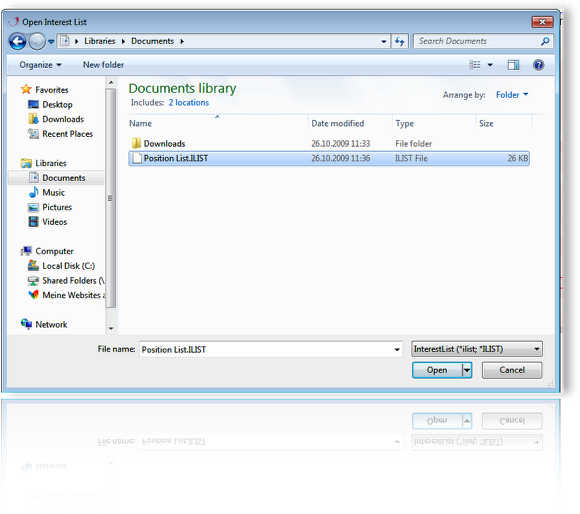
Tab-delimited text files can be load as position list to mark signals within a display. Blue squares indicate marked signals. The position serves as a base for exporting signal intensities from dispalys stored in the database.
Save Position-List
It is possible to generate a postion list in spectromania or manually. The list will be saved as a tab-delimeted text-file.
Adjust Position-List
Adjust Peak List allows to map a saved peaklist to spectra with higher resolutions.
Save Region as Peak...
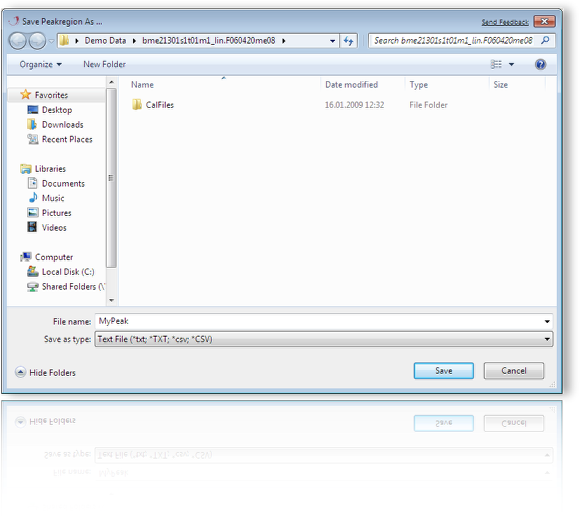
Save a selected region from the mass spectrometric trace to a text file. You can use this file as prototype peak for the razor algorithms (Maximum Entropy Baseline Correction /Smoothing).
Save Memory Layer
The memory layer can be stored: processed data in the memory layer can be exported and reloaded.
Load Memory Layer
To load a stored memory layer.
Set Reference Spectrum...
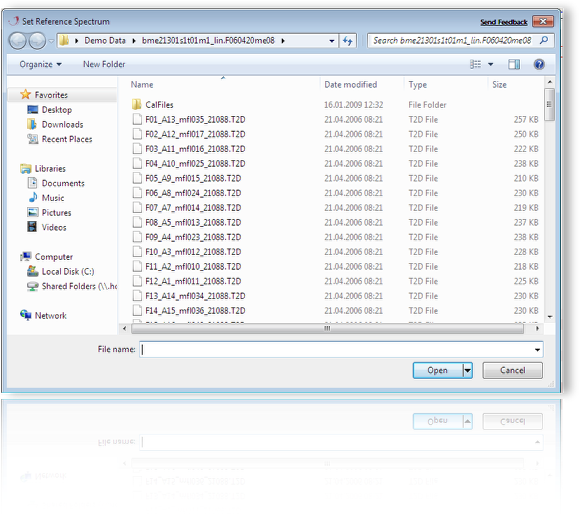
Change the default Reference Spectrum (i.e. X-Vector) for data alignment. For Details see Menu-Process - Downsampling.
View Log File
The log-file is for documentation purposes. This history can be opened, copied or deleted.
Save Display as...
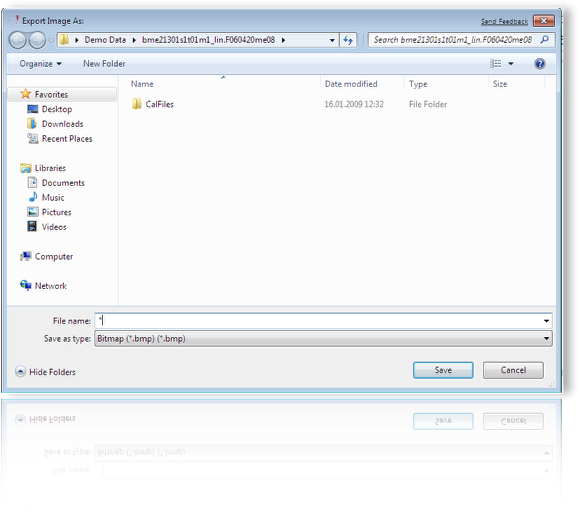
This menu item allows to save the Display as an image.
Save Trace Picture as...
This menu item allows to save the selected mass spectrometric trace as an image.
Save 1D Stat Trace Picture as...
This menu item allows to save the selected trace displaying statistical results as an image.
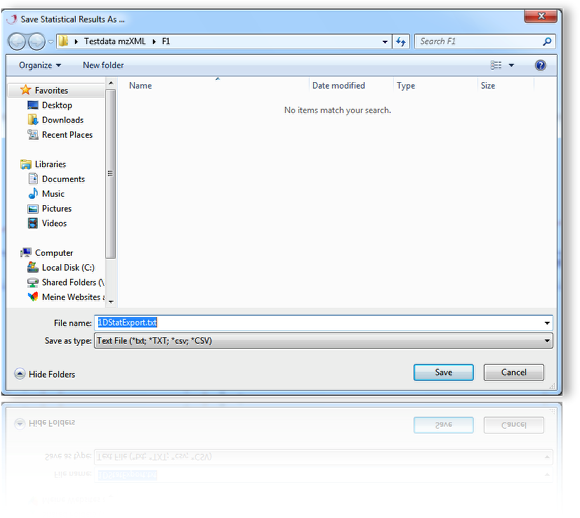
Save Selected Statistical Results
Save Mean Spectrum as .ms...
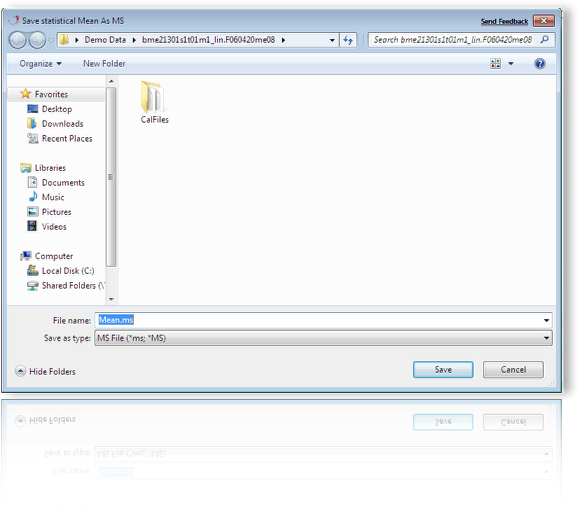
Allows to save a mean mass spectrum. For details about 1D statistics see "Tab Panel - 1D".
Save Data Matrix as .dat
Export Spectra List
Save a list of spectra displayed the upper right box to a text file.
Page Setup
Standard Dialog for the Printer Page Setup.
Standard dialog to print the current view.
Preferences - Miscellaneous
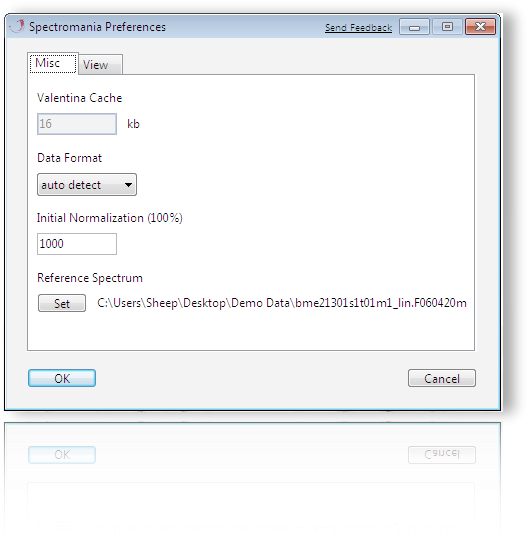
Here the default settings can be modified. The data format for loading files, the data intensity level and a references spectrum can be set.
Preferences - View
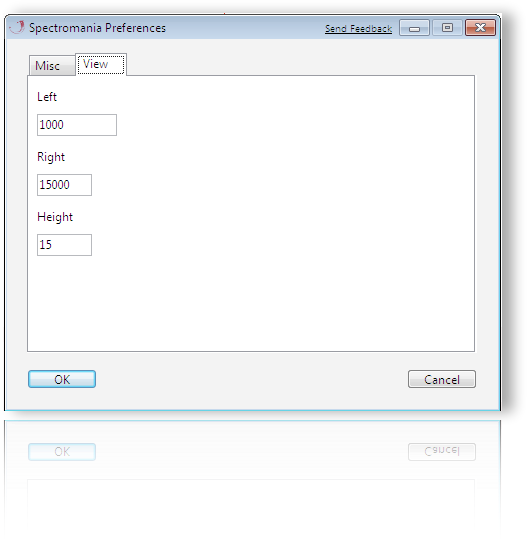
The left and right default margins of the display and the height of each of its lanes can be set.
Quit
Exit program.