A basic workflow
Description of a basic workflow to learn how to load and compare single mass spectrometric data files.
Load Data
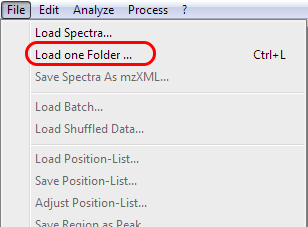
Locate and load a folder containing MS data.
Go to the menu and choose file and then load one folder.
Choose the appropriate folder.
The program scans the folder
and will load all spectra located within the specified folder.
Data resampling and Baseline Correction
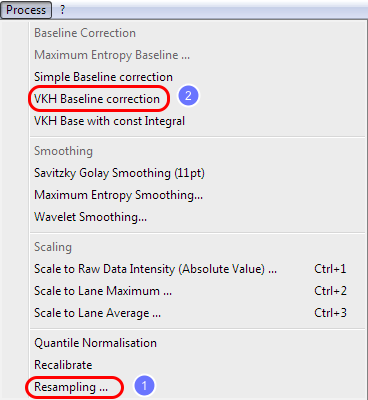
The re-sampling reduces the complexity of the mass spectra, but allow a much faster processing.
Go to the menu and choose process and then resampling.
Use the default values and click OK.
Now go to the menu and choose process and then VKH baseline correction.
Scaling
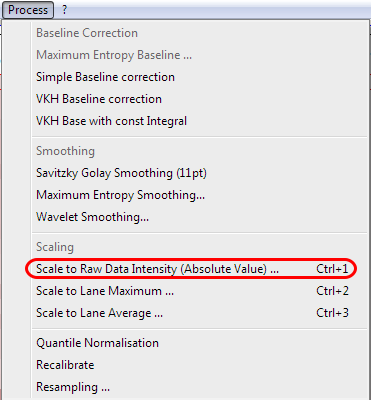
Select the appropriate intensity level and scaling.
You can choose between different scaling options:
Raw data intensity, lane maximum and lane average.
Choose scale to raw data intensity and set the value to 1000.
Click OK.
Store data in memory layer
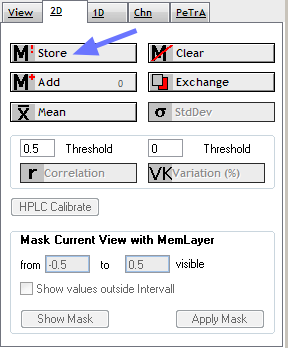
Spectromania supports two data layers:
The current view and the memory layer.
Data is transfered via the current view to the memory layer. Consequently, to store data in the memory layer, it is first required, to load data into the current view.
Select the 2D tab on the right and select store.
Clear data in current view
Go to the menu and choose edit and then
clear data.
Select a second folder and perform step one to three again.
Switch View
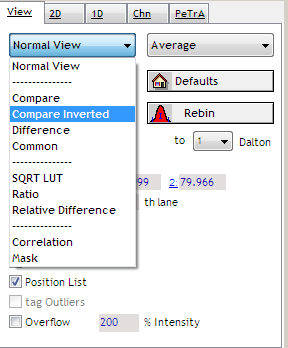
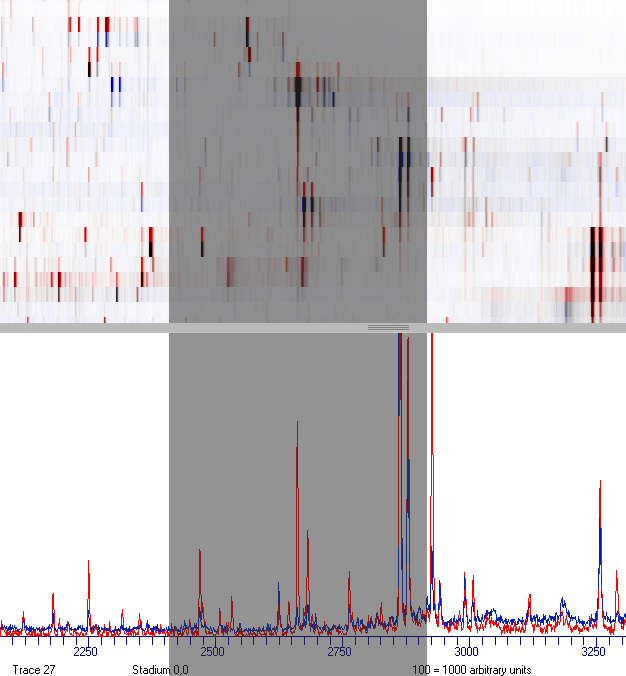
Switch view to compare inverted. The appearance will change from a monochromatic to a colored view.
Visual Comparison
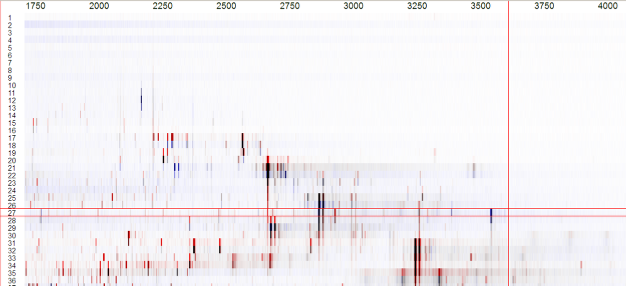
Red signals indicate peaks, which possess a higher intensity in spectra stored in the current view.
Blue signals indicate peaks, which possess a higher intensity in spectra stored in the memory layer.
Black signals possess a comparable intensity in both samples.
Check Memory Trace
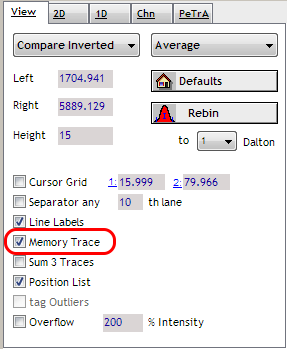
Activiate the memory in the tab panel.
Memory Trace
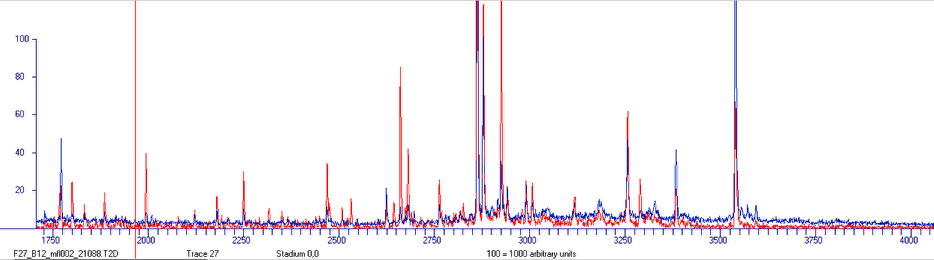
In the lower part of the window a second mass spectrometric trace, colored in blue, will appear.
This trace refers to data from the memory layer.
Selecting Lanes
Select any lane in the current view by clicking.
Compare the main view and the mass spectrometric traces in the lower part of the window.
Zooming
Zoom-in to view details.
To enlarge the view, click and hold the left mouse button.
Drag the mouse to the right and release the button.
To zoom out, click the right mouse button.
To restore the default view, click the defaults button.
Select distinct peaks and match both views to learn to elucidate differences between both datasets.