1D Tab
1D Tab
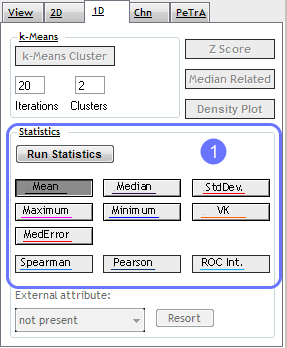
The 1D tab is designed to do statistical analysis of lanes in the current view.
1. To perform statistical calculations between lanes in the current view appropriate methods can be selected. The method can be activated by the buttons (mean, median, standard deviation, maximum, minimum, variation coefficient, medium error). The results are calculated by clicking on the run statistics button and displayed as histograms below the trace view. The color of the histograms refer to the color displayed on the buttons. To activiate the view of the calculated histograms click on the triangle at the left side of the trace view (see Chapter 1- General Concepts).