Process Menu
The menu items of the process menu are explained. The functions are intended to process data loaded into the current view.
Process Menu
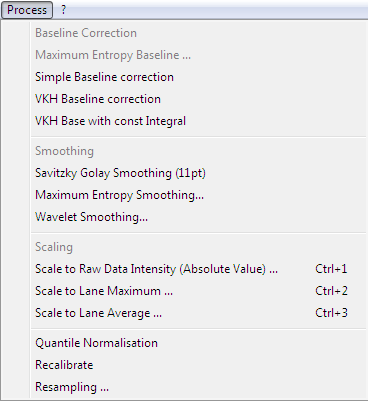
The process menu contains items to modify the data loaded in the current view.
Baseline Corrections
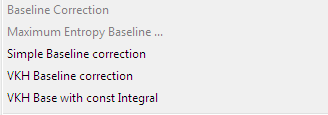
Different algorithms can be used for baseline correction.
Maximum Entrpy Baseline: This baseline correction uses bayesian methods to pick peak regions from the data. The straight lines under the peaks are connected with maximum entropy smoothed off-peak regions. There parameters which have to be specified:
Newbas value 1, 2, 3 or 4 determine the algorithm used for peak picking. Value -1 orders a quick picking function.
iStat governs the noise statistic. Value 1 is for normal noise, 2 for poisson noise.
PSens is the treshold for Signal to noise (S/N) directing the peak picker. A value of 0.0 means that every peak is used, meanwhile values above 0 use only peaks with a heights, below 0 with areas bigger than S/N ratio for baseline estimation.
Output defines the output of the corrected spectrum (1) or the pure baseline (0, for analytical reasons).
Peakshape is a prototype peak that is typical for the expected peaks. It has to be specified to give the peak picker the basis of nature of peaks. The prototype peak can be generated in the menu "File - Save Region as Peakshape".
Simple Baseline Correction: The simple baseline correction is the weakest approach to correct baselines.
VKH-Baseline: The VKH baseline correction was developed in-house to improve maximum entropy baseline correction. Empirically data results are quiet similar, but VKH baseline correction is much faster and stable. In individual cases both methods should be compared to choose the more suitable solution for according data sets. The VKH Baseline correction is the recommended method.
Similar to VKH baseline correction but normalizing the data to a constant integral. You will be prompted for a normalization coefficient prior to proceeding. The procedure is in an experimental stage.
Smoothing
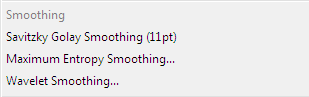
Savitzky-Golay smoothing can be thought of as a generalized moving average to suppress random noise while preserving essentiell parts of the spectrum. The algorithm underlying this method was adapted from Numerical Recipes in C, published by Cambridge University Press. It is recommend to perform a data aligment prior to applying this method.
Maximum Entropy Smoothing: This smoothing method provides a maximum likelihood estimate of a noise-free parent spectrum. The required peak shape for this method is as critical as for the maximum entropy baseline correction.
Wavelet smoothing: During smoothing data goes through a filter process deleting noise signals and leaving the denoised (smoothed) spectrum.
Scale to Raw Data Intensity
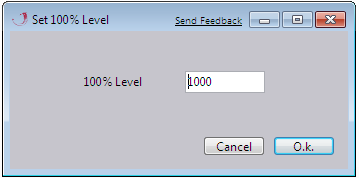
The Intesity (Y-values) is rescaled relative to the specified intensity. The absolute value is assigned to 100% to rescale data according to this ratio.
Scale to lane Maximum
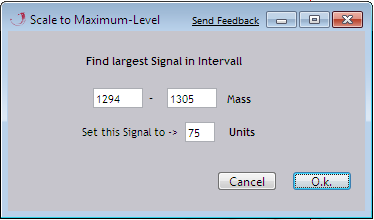
The Intesity (Y-values) is rescaled relative to the maximum intensity. All values in the given region (Mass:X-values) are used to find the maximum value. The estimated maximum is assigned to a specified value (set this signal to) to rescale data according to this ratio.
Scale to Lane Average
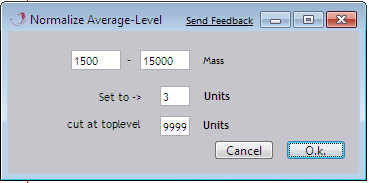
The Intesity (Y-values) is rescaled relative to the average intensity. All values in the given region (Mass: X-values) are used to build the average, except the values above the cutoff treshold (cut at toplevel). The estimated average is assigned to a specified value (set to) to rescale data according to this ratio.
Quantile Normalisation and Recalibrate
Quantile normalization is normalization based on the magnitude of the measures. This algorithm is currently tested and should be used only by experienced users.
Recalibration of data sets is based on a periodical pattern of 1 Dalton peaks in the initial part of mass spectra. This pattern is used to align rows by to the right or left thus correcting mass spectrometric shifts.
Resampling
Resampling is done for 2 major reasons:
1. It leads to data reduction, thus allowing a much faster processing.
2. It aligns individual lanes which is a prerequisite for many statistical algorithms.
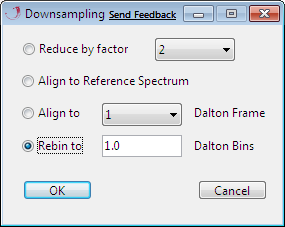
There are several possibilities for Recalibration.
Reduce by factor: reduces the overall amount of data by the given multiplier. This procedure does not align the data (with exception of align to 1/3rd, which is an alignment to a frame).
Align to Reference Spectrum:aligns the Y-data (i.e. signal intensity) to the X-data (i.e. M/Z) of a data set which has to be preset in "File - Set Reference Spectrum".
Align to Frame: aligns data to a predifiened frame with a specified grid of X-values.
Rebin to : intergrates data to a given bin size.